- 3D reports (s-Wall)
-
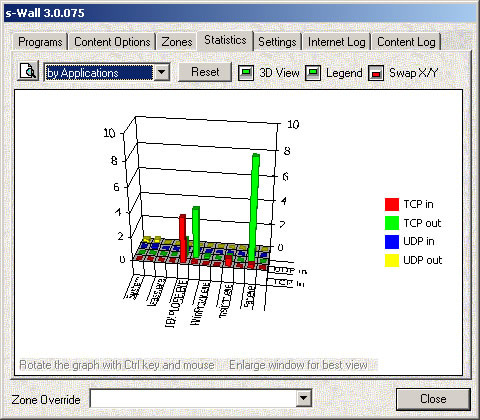
 3D reports allow presenting the internet access summaries graphically. The next graphs are available (separately by TCP/UDP and incoming/outgoing traffic):
 - Applications summaries divided by the protocols
- Day statistics by hours
- Week statistics by days
- Month statistics by days
- Year statistics by months